Data Visualization
Swiftly implement user-centric dashboards to enhance decision-making and insights.

Why Data Visualization
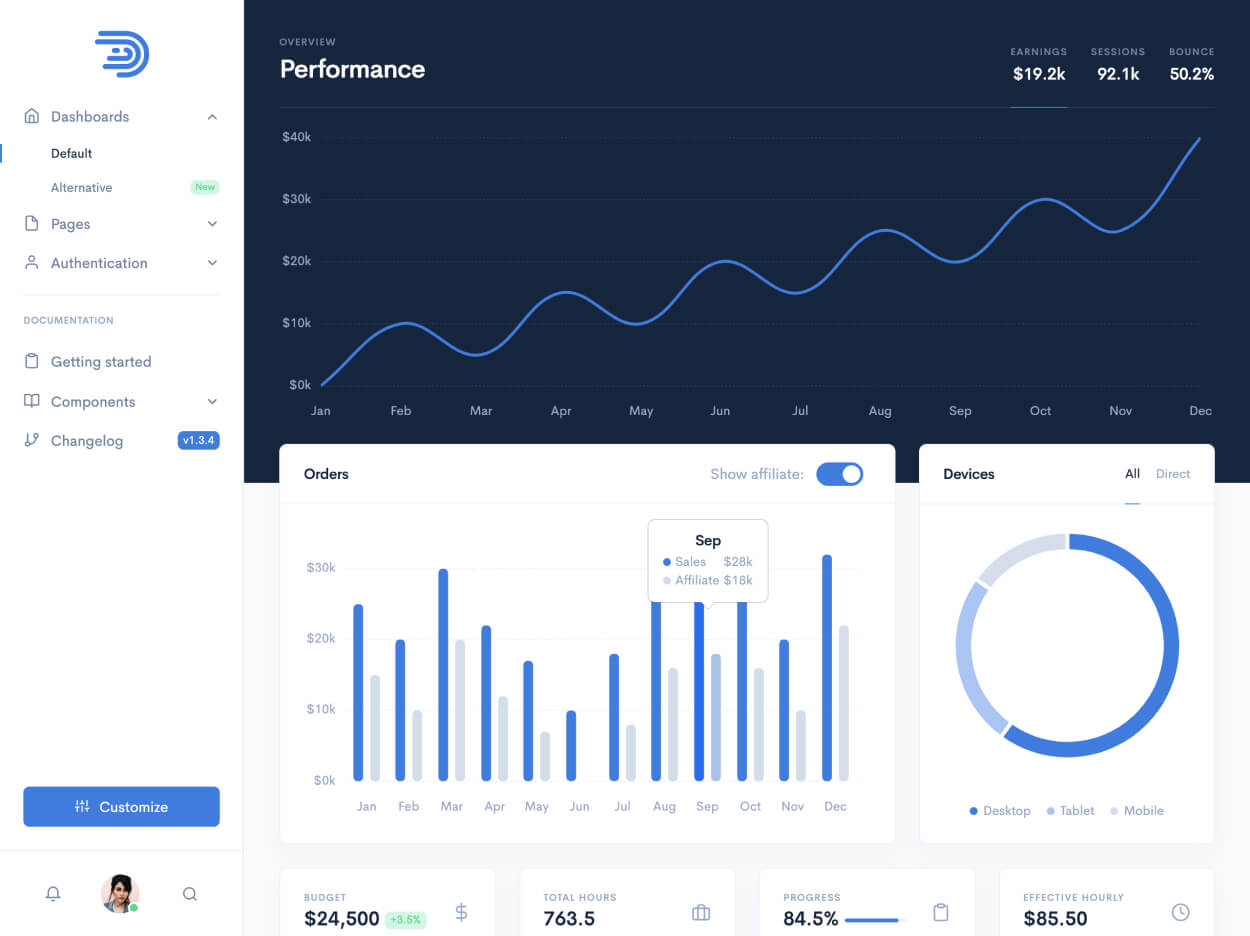
Data visualization provides an accessible way to see and understand trends, outliers, and patterns in data. A good visualization tells a story, removing the noise from data and highlighting useful information.
Data visualization transforms complex datasets into intuitive, visual formats that make it easier to grasp insights at a glance. By presenting data graphically, it reveals hidden relationships, trends, and anomalies that might otherwise go unnoticed. Effective visualizations simplify the data, focusing on the key elements that matter most, enabling decision-makers to quickly identify patterns and take action based on clear, data-driven insights


Build Interactions Visual Dashboard for Your Company
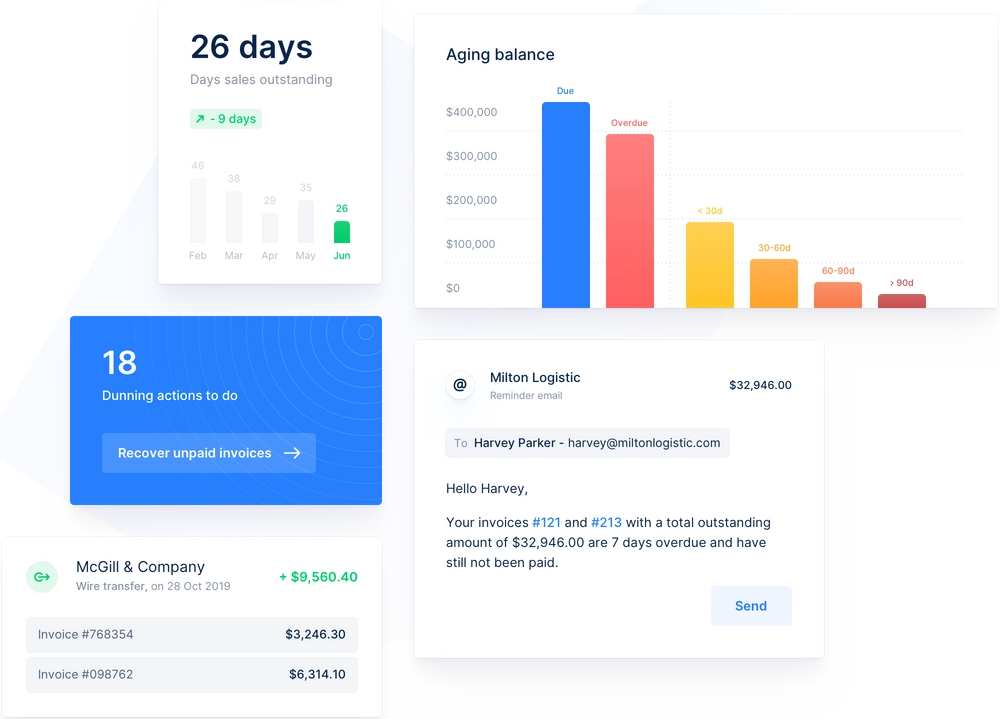
Transform your business operations with an interactive visual dashboard that fosters real-time communication and enhances decision-making. By leveraging integrated products and strong leadership skills, you can streamline resources and optimize performance.
Elevate your business strategy with dynamic, data-driven dashboards that provide real-time insights and improve collaboration across teams. Harness the power of cutting-edge technology to unify data streams, automate processes, and enable swift, informed decision-making. With intuitive visual tools and seamless integration, you can unlock new opportunities, boost productivity, and drive long-term growth.

Why Choose Us
- Regulatory Adherence
- Prospecting
- Visualization
- Increased Engagement
- Decision-Making
- Real-Time Monitoring
Connect with us!
To know more about our services
We can help you to create your dream Application for better business revenue.

